
Start with one operational priority. Expand on the same data foundation.
Elwids captures the parameters behind your machines, buildings, utilities, water systems, and business workflows. FactoryOps, CarbonOps, and HydroOps are configurable intelligence layers on top of the same trusted operational data.
- 10+ industrial sites
- 3 countries
- 120M+ data points / day
- ISO 50001 · ISO 14064 / GHG Protocol · IEC 62443 aligned
Configurable blueprints
Choose the first blueprint to scope.
These are repeatable starting blueprints we configure around your site's operational priority, available signals, workflows, and validation target. Each one runs on the same Elwids foundation, so the next use case can reuse the data model instead of starting another integration project.
Production visibility and downtime intelligence
FactoryOps
Operational priority
You do not know why machines stop until the shift is over.
Intelligence outcome
Live machine state, downtime reasons, OEE-ready rollups, and maintenance alerts from mixed-vendor lines.
Proof point
First pilots target 5-9% recovered lost capacity once the right signals are trusted.
Energy waste and carbon reporting intelligence
CarbonOps
Operational priority
Energy waste hides inside after-hours runtime, demand spikes, BMS drift, and delayed utility bills.
Intelligence outcome
A live baseline, ranked waste shortlist, audit-ready Scope 1 and 2 evidence, and retrofit measurement data.
Proof point
Assessments typically identify 8-18% savings opportunities before new hardware is considered.
Source-to-discharge water intelligence
HydroOps
Operational priority
You cannot control water cost or compliance risk until the source-to-discharge balance reconciles.
Intelligence outcome
Real-time water balance, leak and overflow alerts, reuse opportunities, and permit-ready discharge records.
Proof point
First rollouts target 10-25% lower purchased water where reuse and loss signals are measurable.
Scoping matrix
Use repeatable blueprints, then configure for the site.
These are not rigid off-the-shelf products. They are repeatable starting blueprints we scope around the site's operational priority, available signals, workflows, and validation target.
| Operational priority | Starting blueprint | What we configure | Validation target |
|---|---|---|---|
Downtime context, machine visibility, and shift-level decisions | FactoryOps Production visibility and downtime intelligence | PLC tags · machine state · runtime counters · downtime events · maintenance triggers | Live machine state, downtime reasons, OEE-ready rollups, and line-level automation opportunities. |
Energy waste, demand spikes, and reporting pressure | CarbonOps Energy waste and carbon reporting intelligence | Meters · HVAC and BMS points · schedules · utility records · demand intervals | Live baselines, after-hours waste detection, Scope 1 and 2 evidence, and retrofit M&V. |
Water balance, loss detection, reuse, and discharge compliance | HydroOps Source-to-discharge water intelligence | Flow meters · tank levels · pump states · treatment stages · discharge points · lab and manual records | Source-to-discharge balance, leak and overflow alerts, reuse planning, and permit-ready reporting. |
Critical assets need simulation, relationship context, or AI-ready models | Digital Twins Advanced layer once the asset model is trusted | Historized asset state · contextual tags · relationships · APIs · event streams | Live software mirrors, simulation-ready context, and AI-ready workflows for the assets that matter most. |
Operational priority
Downtime context, machine visibility, and shift-level decisions
What we configure
PLC tags · machine state · runtime counters · downtime events · maintenance triggers
Validation target
Live machine state, downtime reasons, OEE-ready rollups, and line-level automation opportunities.
Operational priority
Energy waste, demand spikes, and reporting pressure
What we configure
Meters · HVAC and BMS points · schedules · utility records · demand intervals
Validation target
Live baselines, after-hours waste detection, Scope 1 and 2 evidence, and retrofit M&V.
Operational priority
Water balance, loss detection, reuse, and discharge compliance
What we configure
Flow meters · tank levels · pump states · treatment stages · discharge points · lab and manual records
Validation target
Source-to-discharge balance, leak and overflow alerts, reuse planning, and permit-ready reporting.
Operational priority
Critical assets need simulation, relationship context, or AI-ready models
What we configure
Historized asset state · contextual tags · relationships · APIs · event streams
Validation target
Live software mirrors, simulation-ready context, and AI-ready workflows for the assets that matter most.
Start with the operational priority that can prove value fastest. The next blueprint can reuse the same trusted data model instead of restarting integration work.
Talk through your siteDeployed in the field
Fabric manufacturing, Sri Lanka.
A live deployment on the floor of a textile manufacturer: mixed-vendor machines, utilities, water systems, and cold storage feeding one operational data layer. The same foundation supports production, energy, water, and cold-chain intelligence.
One view across stenter lines, utilities, and cold rooms.
Production machines, steam and water systems, energy meters, and cold-room sensors stream into the same Elwids core. Engineering, utilities, and maintenance teams work off one source of truth for operational intelligence — no parallel SCADA, no spreadsheet hand-offs.
Asset groups
6 connected
Teams served
Engineering · utilities · maintenance
Rollout model
Existing devices first
Assets monitored
Stenter machines
Run state, throughput, machine utilization.
Fabric production
Per-line output and quality signals.
Energy
Plant and feeder-level consumption.
Steam systems
Boiler load, distribution, and losses.
Water & reservoirs
Reservoir levels, flow, and reuse.
Cold rooms
Temperature, humidity, and excursion alerts.
Advanced layer
Digital Twins come after the asset data is trusted.
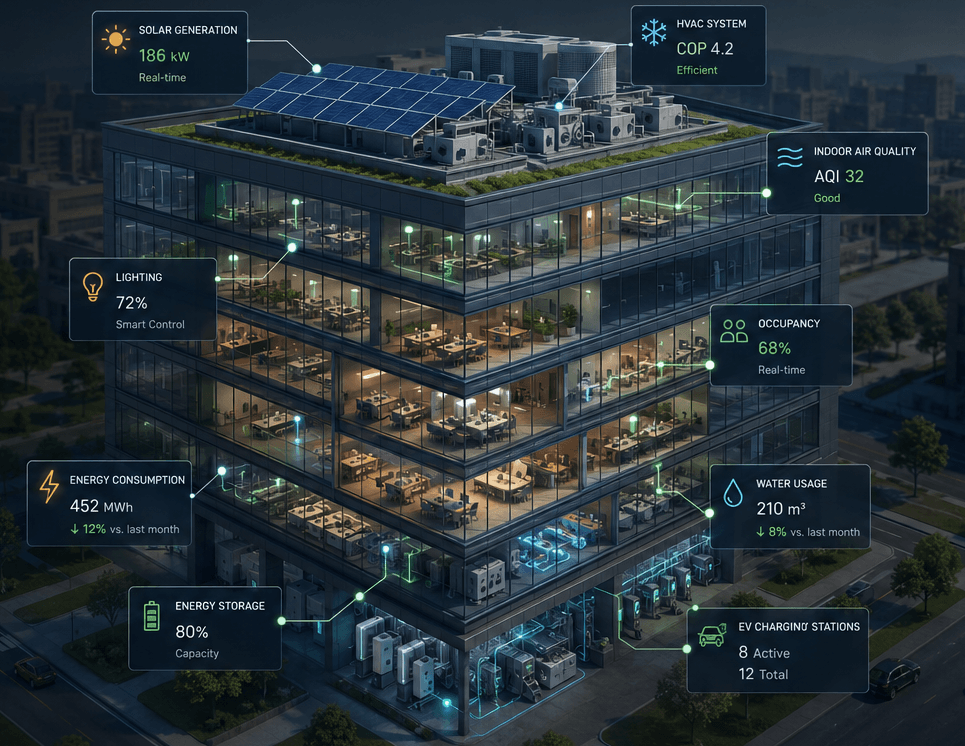
Digital Twins are not a separate starting point or a static model. They sit on top of the Elwids foundation when parameters are captured, calibrated, historized, and contextualized enough to mirror the assets that matter most.
Live software mirror
Each connected asset has a current-state representation backed by trusted, normalized telemetry — not a static CAD model.
Context and relationships
Lines, rooms, utilities, and parent-child asset relationships travel with the data, so queries answer in operational terms.
Twin-ready for AI and simulation
Once parameters are calibrated and historized, the same model feeds what-if analysis, predictive workflows, and AI agents.
Ready to try
Start with a 30-day assessment.
The fastest way to see the platform produce concrete results: one site, line, building, or asset group, using your existing data first.